Get Deeper into the Insights!
In case you don't have a power BI account, get your research done with the image below.
For the interactive analysis, create account on Power BI
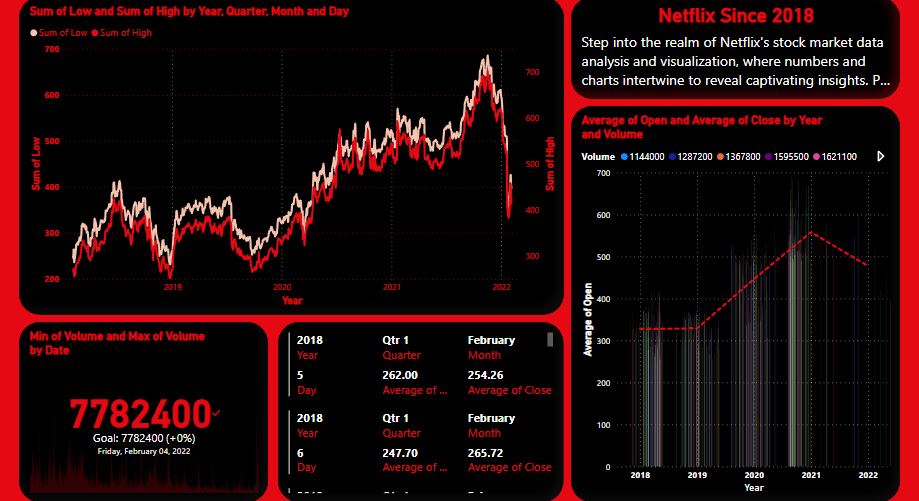
The Streaming Maestro's Stock Market Performance
Imagine a visually stunning representation of Netflix's stock performance, resembling the ebb and flow of a captivating film. Peaks and valleys, akin to plot twists and climactic moments, illustrate the ever-changing market sentiments surrounding the company.
The visualisation reveals the steady rise of Netflix's stock over time, mirroring the company's groundbreaking success in the streaming industry. As the chart ascends, it symbolises the transformative power of Netflix, captivating viewers worldwide and disrupting traditional entertainment channels.
Line Chart Patterns
This creative data visualisation presents the sum of high and low stock prices, spanning different time periods—year, quarter, month, and even day.
Observing the peaks and valleys allows us to identify periods of significant growth, market turbulence, or transformative events. This insight unveils the impact of macroeconomic factors, company announcements, and market sentiment on Netflix's stock performance throughout the years.
Sudden spikes, sustained growth, or periods of consolidation reveal market dynamics and investor expectations. This insight assists investors and analysts in making informed decisions, identifying potential buying or selling opportunities, and predicting future trends.
A Multirow Card Analysis
The multirow card allows us to identify days where Netflix's stock witnessed significant changes in value from opening to closing. Large gaps between the two values could signify periods of high market volatility, where bullish or bearish sentiments dominated the trading session. These insights offer a glimpse into investor behaviour and the market forces that shaped Netflix's stock performance.
Lines from From Peaks to Valleys
As we travel through the chart, we notice a crescendo of rising average opening prices, signalling Netflix's entrance into the stock market. This insight captures the excitement surrounding the company's initial public offering and the anticipation of its potential success. It underscores the transformative power of disruptive technologies and the investor enthusiasm for emerging players in the entertainment industry.
Vibrant colours or varying line thicknesses illustrate the intensity of trading activity throughout the years. Observing the legend alongside the line chart reveals moments of high trading volume, which often align with significant price movements or market events. This insight emphasises the interplay between investor sentiment, trading activity, and stock price trends.
Key Takeaways!
A. Netflix's rise to prominence has disrupted traditional media channels and ignited a paradigm shift in how audiences engage with content. This insight highlights the company's pivotal role in shaping the streaming revolution and redefining the future of entertainment.
B. The analysis of complete Netflix data emphasises the significance of data-driven decision making within the company. Insights into viewer preferences, consumption patterns, and engagement metrics empower Netflix to make informed choices regarding content investments and audience targeting.
C. The analysis of complete Netflix data reveals the importance of a consumer-centric approach in building a loyal subscriber base. User reviews, recommendations, and personalization algorithms drive customer satisfaction and retention.